Vehicle Results
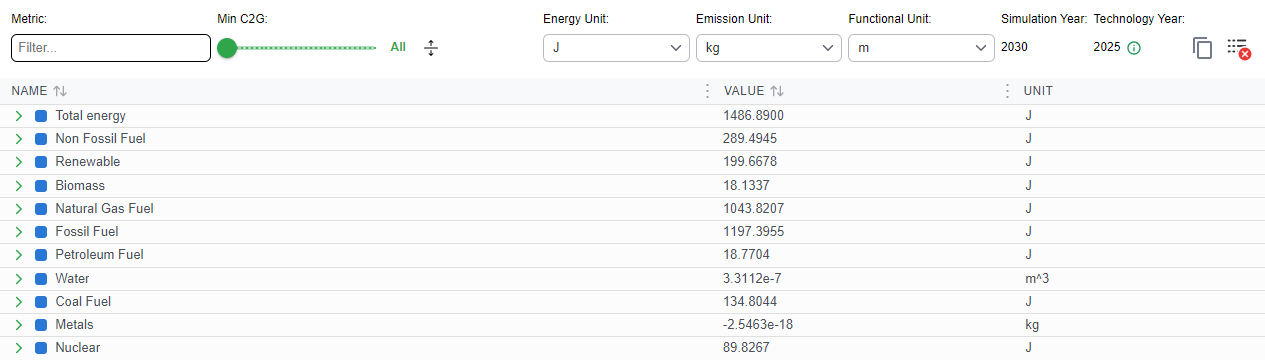
PyGREET calculates the vehicle results and shows them in a collapsible tree table with three columns: Name, Value and Unit.
Important
You can generate results in the vehicle editor only for standard vehicles, that is, vehicles with no material or fuel whose source type is "Output of a Previous Process". Model non-standard vehicles in a pathway. Their results there have the same format as the results described here.
Reading the Results Tree
Each metric, for example Total Energy, is a top row that shows its cradle-to-grave (C2G) value. Expand it to see these rows in order:
- C2G, with one row for each material group under it.
- WTW, the well-to-wheels value. It contains:
- WTP, the well-to-pump value.
- Vehicle Operation, which contains Non-Exhaust Emissions and one row for each operational mode.
PyGREET does not show rows that have no value. Each row has a copy action when you hover over it.
Results View Controls
The controls above the tree set what the table shows.

| Control | What it does |
|---|---|
| Metric: | Filters the rows by metric or resource name. Start typing to filter. |
| Min C2G: | A slider that hides metrics whose C2G value is below a minimum, for example to show only values of 1e-5 or more. It appears only when the values have a range. |
| Expand or collapse all icon | Expands or collapses every row. |
| Energy Unit:, Emission Unit:, Functional Unit: | Lists that set the units of the results. |
| Simulation Year: | Shows the simulation year. |
| Technology Year: | Shows the technology year. It is read-only. Hover over the info icon for an explanation. |
| Copy Results | Copies the table to the clipboard for pasting into Microsoft Excel or a similar program. |
| Calculation logs icon | Shows whether the calculation finished with errors. See Check Calculation Errors. |
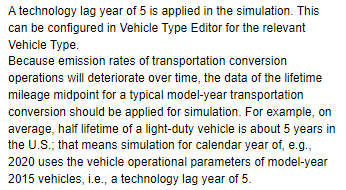
The Technology Year is the simulation year minus the technology lag year of the vehicle type. For example, with a simulation year of 2030 and a lag of 5 years, the technology year is 2025. The lag is set per vehicle type in Vehicle Types.