Pathway Results
The Results Tab shows the life cycle inventory and impact results of a pathway. The same views serve pathways and pathway mixes that have no vehicle.
Note
For results of a pathway that contains a vehicle node, see Vehicle Results.
Choose a Results View
The results header has six view buttons, in this order. Each button is named by its tooltip.
| Button | What it shows |
|---|---|
| Results | The table of inventory and impact results (the initial view) |
| Well-to-use metric contribution | A chart of each process's contribution to a metric, using a well-to-use system boundary |
| Direct & upstream metric contribution | A chart that splits each process's contribution into direct and upstream parts |
| Well-to-use relative metric contribution | A chart of each process's share of the metric, as a percentage of the total |
| Contribution Analysis | A tree of the processes that contribute to a metric |
| Graphical Results View | The pathway canvas with results for each process |
After the view buttons come Copy Results, Export to Excel and the calculation logs icon.
Set the Header Controls
The header has two controls that apply to the pathway:
- Selected Product: a list. Select the product to show results for.
- Target Year: a readout of the year the results are calculated for.
Every view except Graphical Results View and Contribution Analysis also shows the functional unit of the selected product in the header. Graphical Results View has its own Functional Unit list in the view. Contribution Analysis has no functional unit and has its own picker.
Results Table
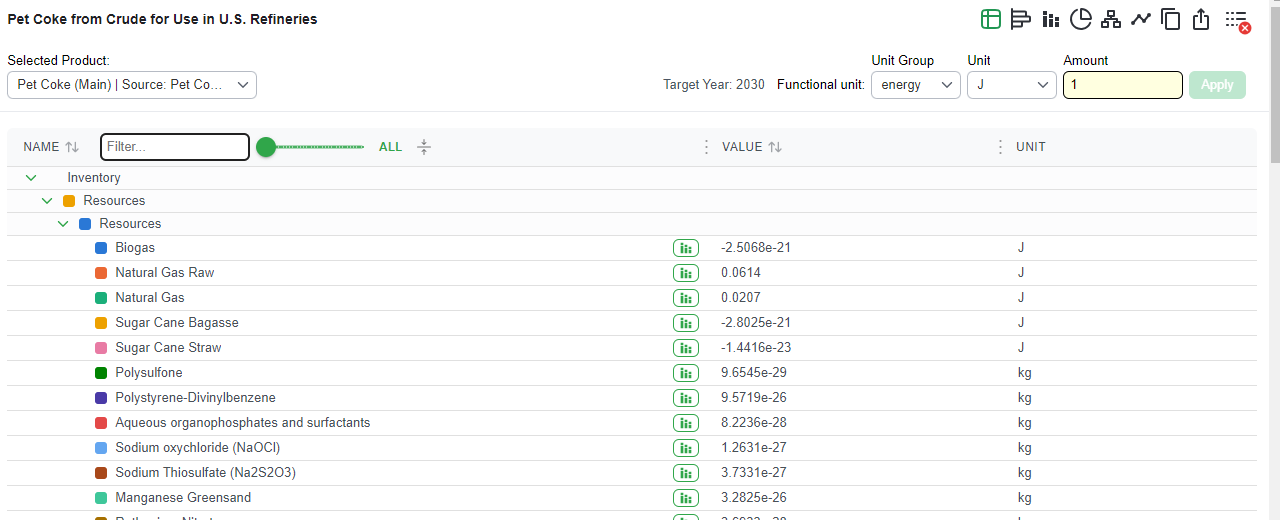
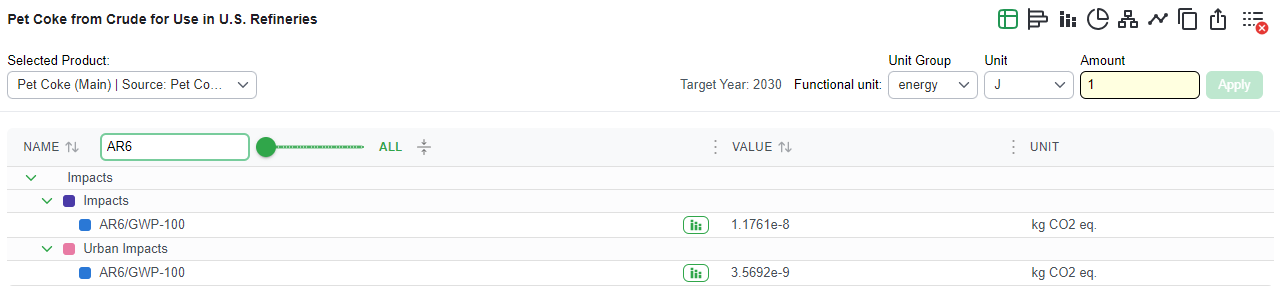
The Results view lists the life cycle inventory and the impacts in a table.
- Select a section to expand it and show the nested results.
- Use the search bar to filter the table by metric name, for example Total Energy.
- Use the metric value slider to filter the table by a minimum value, for example metrics of 1e-5 or more.
- Select the graph button on an impact or inventory item to show the well-to-use metric contribution for that item.
- Select Copy Results to copy the whole table, or the filtered table if a filter is applied. To copy one result, hover over its row and select the clipboard icon on the right.
- Select Export to Excel to export the complete pathway results, including the direct and upstream metrics of each pathway element.
- Hover over the calculation logs icon to see whether the calculation finished with errors. The icon has no text label. See Calculation Error Logs.
Other Results Views
- Metric Contribution Charts: each process's contribution to a metric, as a chart.
- Contribution Analysis: the processes behind a metric, as a tree.
- Graphical Results View: the results of each process on the pathway canvas.