Metric Contribution Charts
This is one of the views of Pathway Results.
To open a metric contribution chart:
- Select a metric, unless you already did so with the graph button in the results table.
- Read the chart that shows the breakdown of the selected metric.
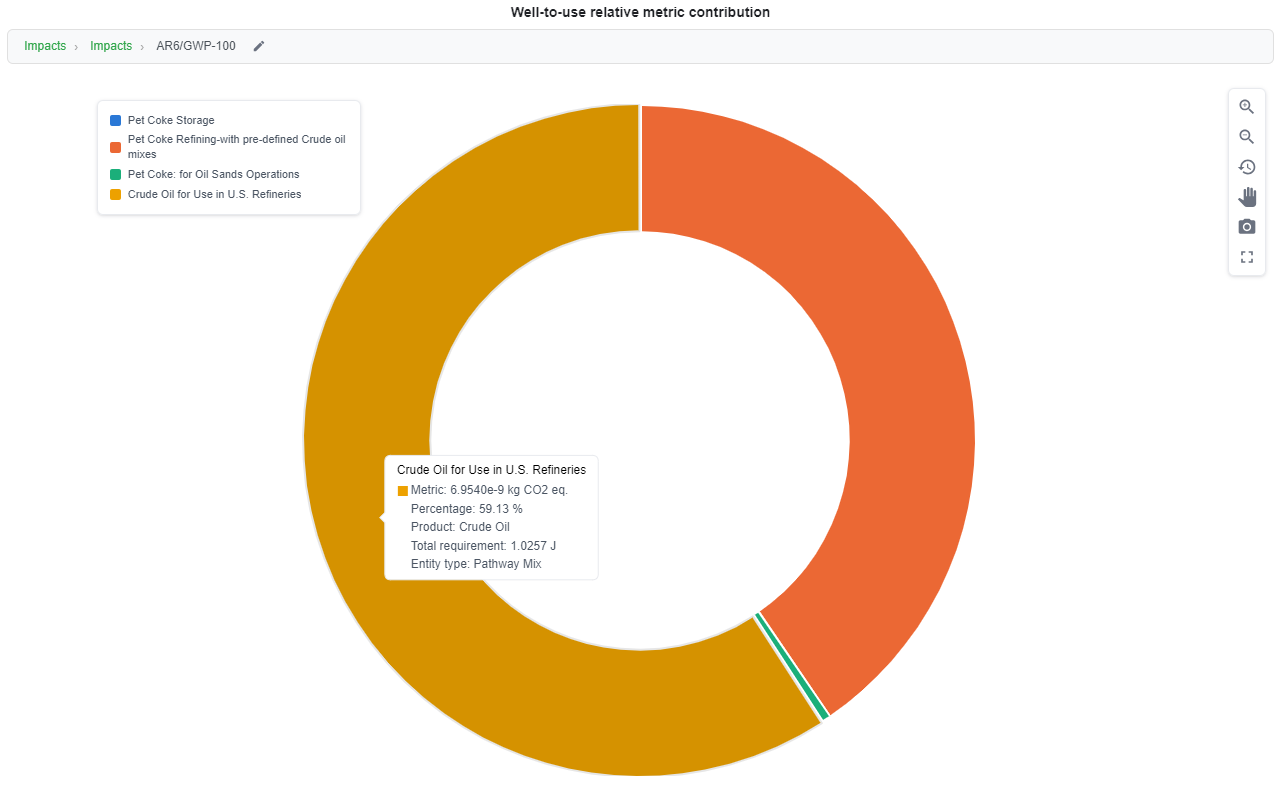
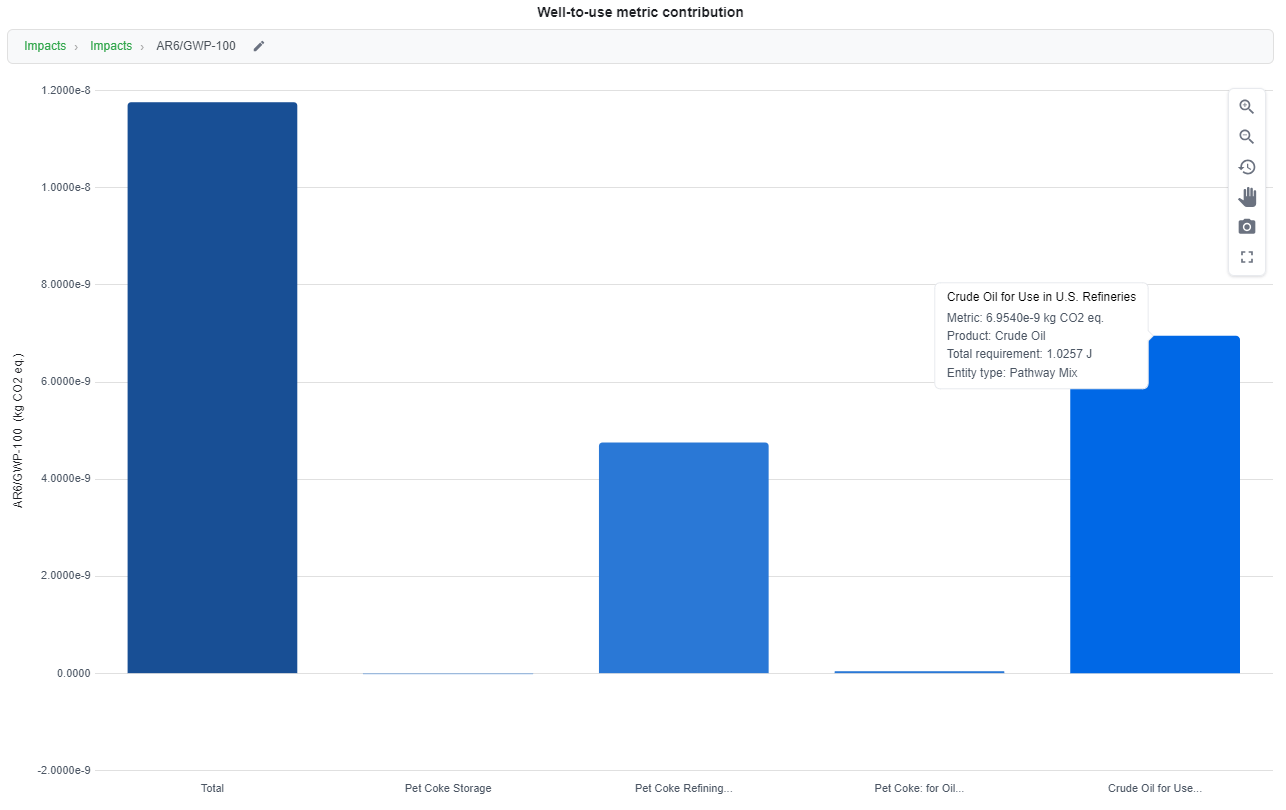
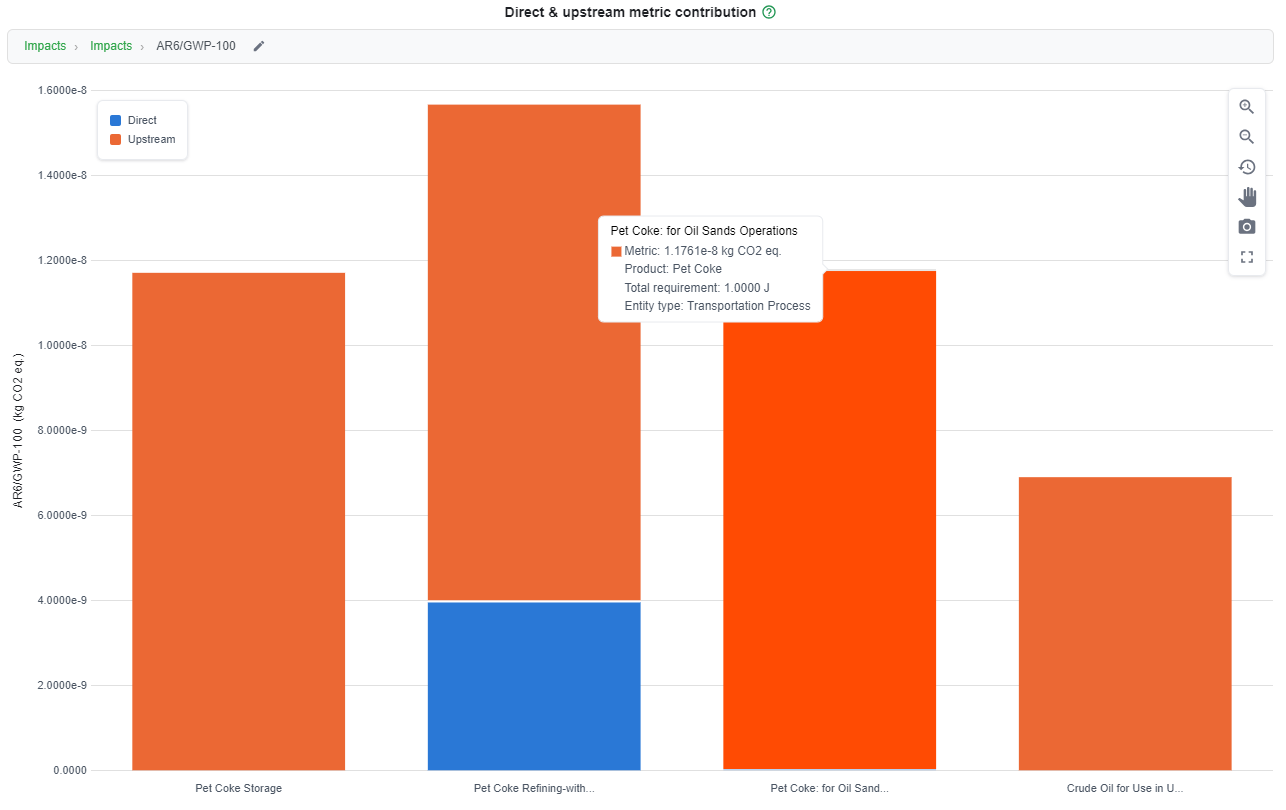
Hover over a bar or segment to see its metric value, product, total requirement and entity type. A toolbar at the top right of each chart holds the chart controls.
Tip
In any contribution chart, select the pencil icon next to the metric name at the top of the chart to switch to a different metric.
Well-to-Use Metric Contribution
This chart shows the contribution of each process in the pathway, using a well-to-use system boundary. The chart below shows AR6/GWP-100 for Pet Coke from Crude for Use in U.S. Refineries.
Direct and Upstream Metric Contribution
This chart shows the same processes, with each bar split into its direct and upstream contributions.
Well-to-Use Relative Metric Contribution
This chart shows each process as a percentage of the total impact, using a well-to-use system boundary.