Contribution Analysis
This is one of the views of Pathway Results.
Contribution Analysis shows where a metric is produced and how each process relates to the main process. It follows the process chain, so you can see where an emission comes from within the nested chain of dependencies.
At the top of the view, select the product and the slice of the results to analyze. The slices include emissions and urban emissions, resource use, and the selected impact. Then select the metric.
The view is a tree table with these columns: Contribution %, Process, Required amount, Total result and Direct.
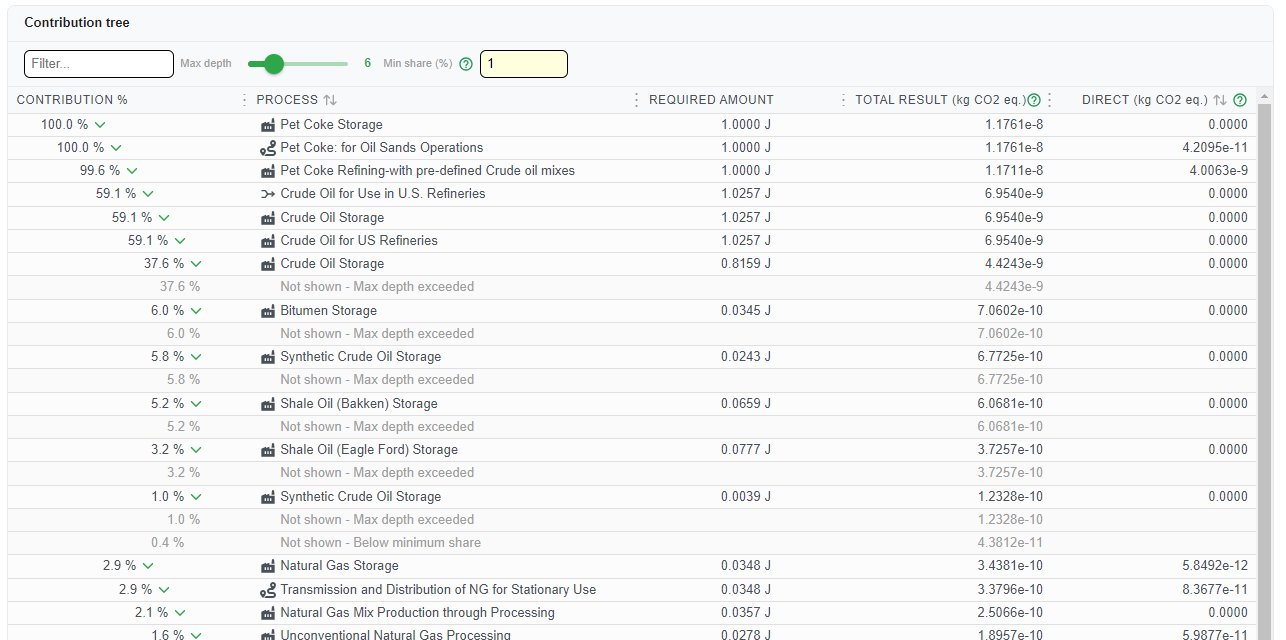
Two controls set how much of the tree you see, in addition to the metric selection:
- Max depth sets how deep the analysis goes. With a maximum depth of 10, the tree shows processes 10 levels deep and groups any deeper process as "Not Shown - Max Depth Exceeded".
- Min share sets the smallest percentage of the metric you want to see. The tree groups any process chain below that percentage as "Not shown - Below minimum share".