Graphical Results View
This is one of the views of Pathway Results.
Graphical Results View shows the pathway on the canvas, in the same layout as the Pathway Editor Tab. A table to the right of the canvas shows the results for the entire pathway, in the same format as the results table. Select the canvas to show the results for the entire pathway again.
Select a node, or one output within a node, to show the results for that process, including direct and upstream results. A node with three outputs gives you results for the node and for each output.
You cannot move or delete nodes in this view, because it is for reading results, not for editing the pathway.
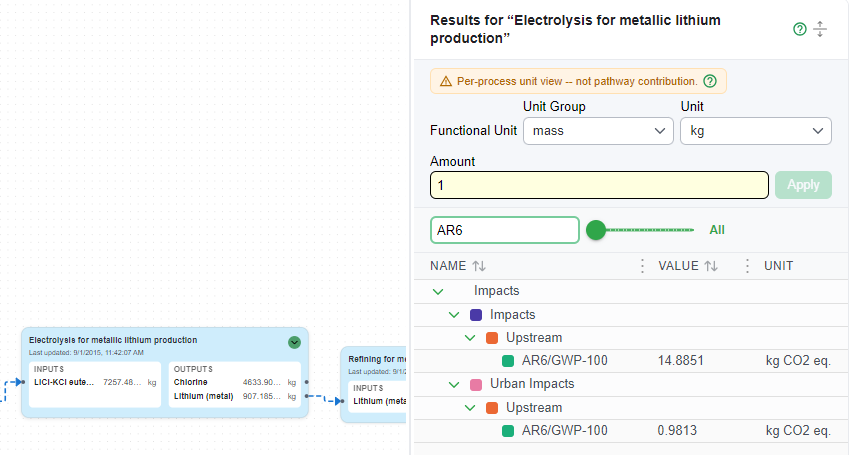
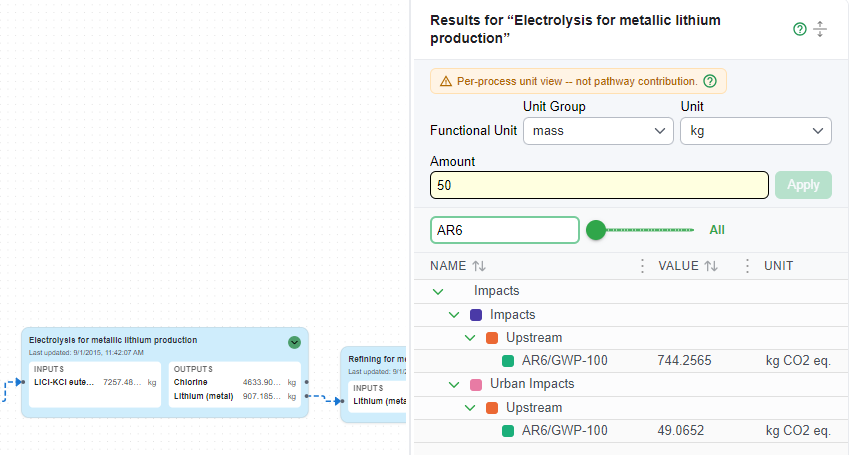
The first time you view process results, PyGREET scales them to 1 of the output's unit. To scale them, type an amount and select apply. If the output can be converted between dimensions, you can also choose a different unit group.
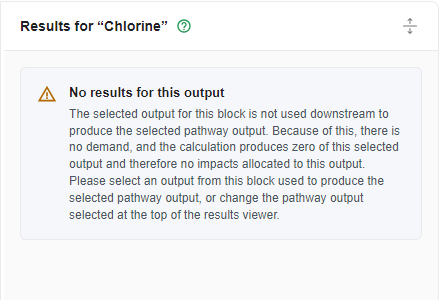
If a process output does not contribute to the selected final output of the pathway, its demand is 0. A note in the process results says so.
Select the reset button to return the process results to their default.